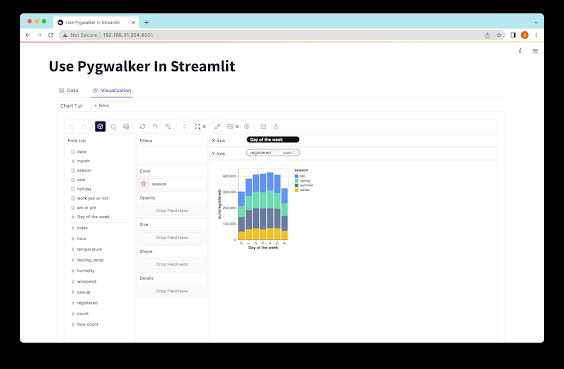
How to Make Effective Area Charts for Data Visualization
In recent years, data visualization has become increasingly important for businesses and organizations to make sense of the vast amounts of data at their disposal. Traditional charts and graphs have become too limiting in their ability to convey complex data sets in an easily understandable way. This is why the area chart, also known as the area graph, has become a popular tool for visualizing data and trends. In this article, we’ll take a look at how to make area charts and how they can be used in data analysis.
First, let’s define what an area chart is. An area chart is a type of chart used to represent data over time or other dimensions, where the graph is filled with a color or gradient to represent the extent of the variable being measured. It's similar to a line chart, but the area between the line and the horizontal axis is filled in. The height of the area represents the value of the variable.
Making an area chart should be easy enough for anyone, even if they don't have a background in data science or visualization. There are many different software and tools available today that make data visualization simple and accessible to anyone, regardless of their level of expertise. Augmented Analytics tools with built-in data visualization features can be used to create area charts in just a few steps.
Here’s a basic tutorial on how to make an area chart:
1. Select your data: The first thing to do is choose the data you want to represent. This can be done using various sources such as Excel spreadsheets, CSV files, or SQL queries.
2. Choose a software or tool: There are many different data visualization tools available, such as Microsoft Excel, Google Sheets, and Tableau. Choose one that you're comfortable with or that works best for your needs.
3. Select the area chart type: In most software, go to the chart type section and select the area chart. Once you’ve chosen the area chart type, you can customize the chart to your liking.
4. Add data: Now you can add your data to the chart. Depending on your software, you may be able to import data directly from your data source.
5. Label your axis: Make sure to label your vertical and horizontal axis with meaningful titles to make it clear what the data represents.
6. Customize your chart: You can customize your chart with colors, scales, and added features like a grid or axis break.
7. Save and share your chart: Once you’re happy with your area chart, save it and share it with your team or stakeholders.
Data visualization examples
Let’s take a look at some data visualization examples of how area charts can be used to visualize data:
Sales Figures: An area chart can be used to show sales figures over time. You can add different colors to represent different types of products and compare their sales trends over time.
Website Traffic: An area chart can be used to show website traffic over time. You can add different colors to represent different types of traffic sources, such as organic, paid, referral, and direct.
Stock Prices: An area chart can be used to visualize stock prices over time. The chart can be used to compare the performance of different stocks and highlight trends in the market.
Make a bar chart
If you're interested in making a bar chart instead of an area chart, the steps are similar but with a few differences. Here's how to make a basic bar chart:
1. Choose your data source.
2. Choose your chart type, select a bar chart.
3. Add your data to the chart.
4. Label your axis with meaningful titles.
5. Customize your chart with colors, scales, and other features.
6. Save and share your chart.
In conclusion, area charts are an effective way to visualize data and identify trends over time. They are easy to make using various tools such as Excel or Tableau and can be customized to meet specific needs. Whether you're analyzing sales figures, website traffic, or stock prices, a well-designed area chart can help you make sense of complex data and identify opportunities for improvement. Remember to choose the right software, select the right chart type, add your data, customize your chart, and share it with your team or stakeholders. With these steps, you'll be able to create compelling and informative area charts that convey insights to your organization.

Comments
Post a Comment