Posts

Optimizing SQL Queries in Pandas: Pandas to SQL Made Easy!

Tutorials Pandas Optimizing SQL Queries in Pandas: Pandas to SQL Made Easy! Optimizing SQL Queries in Pandas: Pandas to SQL Made Easy! Python NumPy Array Tutorial: Create, Manipulate, and Visualize Arrays How to Create Histograms in Pandas: Step-by-Step Guide Read more about Data Analysis

How Fix for 'Conversation Not Found' Error on ChatGPT with Ease

Tutorials ChatGPT How Fix for 'Conversation Not Found' Error on ChatGPT with Ease How Fix for 'Conversation Not Found' Error on ChatGPT with Ease Can Chat GPT Create Charts? Yes and How How to Turn On Chat GPT Developer Mode - Simple Guide Read more about Data Analysis

How to Turn On Chat GPT Developer Mode - Simple Guide

Tutorials ChatGPT How to Turn On Chat GPT Developer Mode - Simple Guide How to Turn On Chat GPT Developer Mode - Simple Guide How Fix for 'Conversation Not Found' Error on ChatGPT with Ease Reverse Prompt Engineering with ChatGPT: A Detailed Guide Read more about Data Analysis

Reverse Prompt Engineering with ChatGPT: A Detailed Guide

Tutorials ChatGPT Reverse Prompt Engineering with ChatGPT: A Detailed Guide Reverse Prompt Engineering with ChatGPT: A Detailed Guide How to Turn On Chat GPT Developer Mode - Simple Guide OpenLLM: Easily Take Control of Large Language Models Read more about Data Analysis

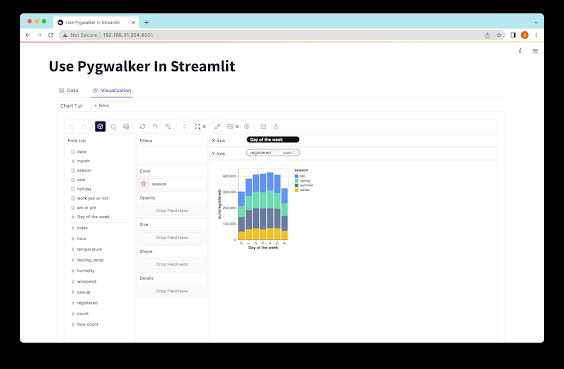
Streamlit and Pygwalker: Simplifying Data Visualization and Exploration

Image
Streamlit and Pygwalker: Simplifying Data Visualization and Exploration Get ready to embark on a thrilling adventure into the world of data exploration with Streamlit and Pygwalker! Discover the incredible capabilities of these two powerful Python libraries as we delve into interactive data visualization and analysis. Introducing Streamlit Streamlit is a game-changing Python library that takes the hassle out of building interactive web applications from your data scripts. Say goodbye to the complexities of web development and coding challenges! Streamlit is fast, open-source, and free, making it the perfect solution for creating and sharing data applications. What Can Pygwalker Do? Pygwalker is another fantastic Python library designed specifically for data analysis and visualization. With Pygwalker, data scientists and analysts can effortlessly generate captivating visualizations such as scatter plots, line plots, bar charts, and histograms. The best part is, you don't need any c...
Google Data Studio vs Tableau: An In-Depth Comparison You Can't Miss

Google Data Studio vs Tableau: An In-Depth Comparison You Can't Miss 📚 Data Governance vs. Data Management: Unlocking the Power of Organizational Data Best Data Profiling Tools for 2023: What's Your Best Fit? Read more about Data Analysis